


The conventional wisdom in machine learning often suggests that providing a model with more information inevitably leads to superior predictive power. This "kitchen-sink" approach to feature engineering—where every available data point is fed into a model—is frequently motivated by the desire to capture every possible nuance of a complex system. However, recent technical evaluations and production post-mortems reveal that this instinct often introduces hidden structural risks that outweigh marginal gains in accuracy. In the context of regression models, the inclusion of redundant, highly correlated, or low-signal features creates a phenomenon known as production fragility. This fragility manifests as weight instability during retraining cycles and an increased sensitivity to data drift, effectively turning a sophisticated model into a liability when deployed in live environments.

The Hidden Costs of Feature Bloat
In modern data science, the cost of a feature is rarely measured in terms of computational power alone. Instead, the true cost lies in the complexity of the upstream infrastructure required to maintain it. Every additional feature represents a hard dependency on an upstream data pipeline, an external system, or a specific data quality check. In a production setting, a single missing field, a schema change in a third-party API, or a slight delay in a partitioned dataset can quietly degrade predictions without triggering immediate system failures.
Beyond the engineering overhead, the deeper mathematical issue is weight instability. Regression models, particularly those using Ordinary Least Squares (OLS) or Ridge regularization, rely on an optimizer to assign "credit" to various features. When features are highly correlated—a condition known as multicollinearity—the optimizer struggles to distribute influence meaningfully. This results in coefficients that shift unpredictably as the model attempts to navigate overlapping signals. Consequently, low-signal variables may appear statistically significant simply due to noise, leading to models that appear robust on paper but behave inconsistently when exposed to new data.

Analysis of Weight Dilution and Multicollinearity
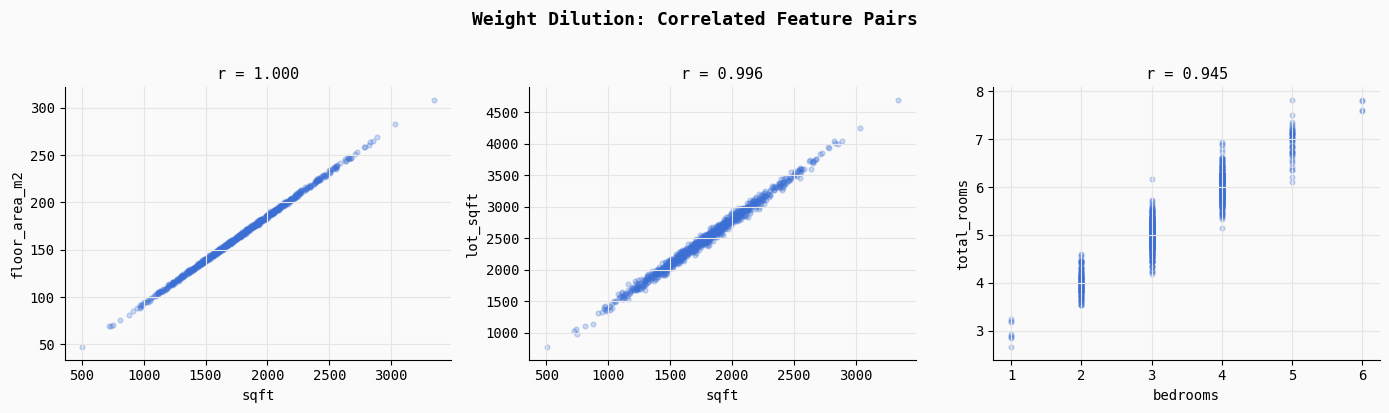
To quantify the impact of redundant features, researchers often utilize controlled synthetic environments, such as property pricing datasets, to isolate the effects of feature bloat. In a recent benchmark study involving 800 training samples, a "lean" model consisting of three core signals—square footage, number of bedrooms, and neighborhood quality—was compared against a "noisy" model containing over 100 features, including unit conversions and random noise columns.
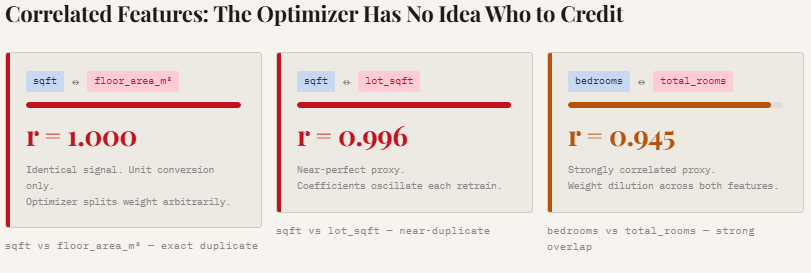
The study highlighted the dangers of multicollinearity by introducing features like "floor area in square meters" alongside "square footage." Statistically, these pairs exhibited a near-perfect correlation (Pearson r ≈ 1.0). When such redundant features are present, the regression optimizer faces a mathematical ambiguity. Because the two features move in lockstep, the model cannot definitively determine which one is responsible for the change in the target variable. This leads to "weight dilution," where the influence of a strong predictor is split across several redundant variables, making the model’s internal logic difficult to interpret and highly sensitive to minor fluctuations in the training data.
Simulated Operational Lifecycle: The Retraining Crisis
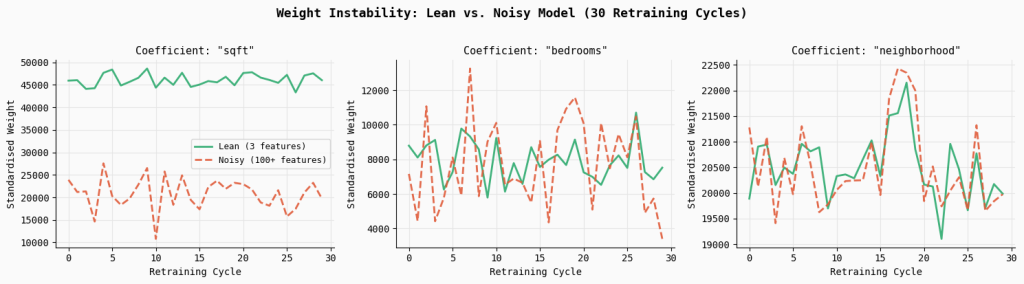
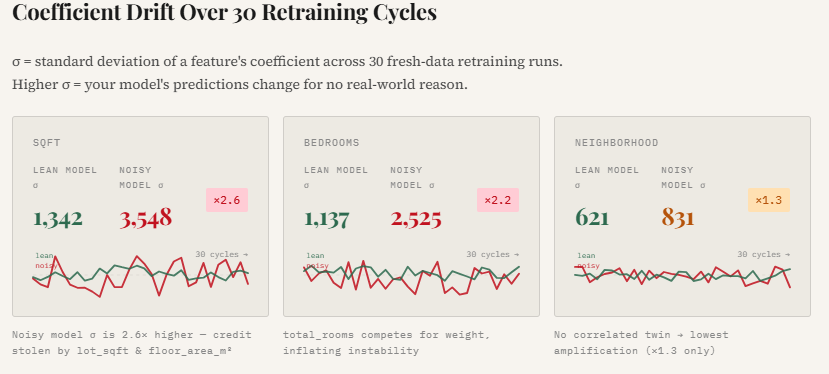
The most significant evidence of production fragility emerges during the model retraining phase. In most industrial applications, models are not static; they are periodically retrained on fresh batches of data to account for changing market conditions. A simulation of 30 retraining cycles, using random subsets of the property dataset, demonstrated a stark contrast between lean and noisy architectures.
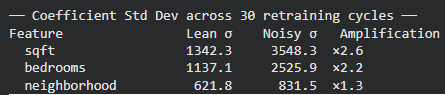
The results indicated that the "noisy" model exhibited significantly higher coefficient variability. For instance, the standard deviation of the square footage coefficient in the noisy model was found to be 2.6 times higher than that of the lean model. Similarly, the coefficient for the number of bedrooms became 2.2 times more unstable. This instability suggests that in a noisy environment, the model’s "understanding" of the world changes drastically with every small change in the input data. For a business relying on these models for decision-making, such volatility can lead to wildly different outcomes for the same input across different versions of the model, undermining trust in the automated system.
Signal-to-Noise Ratio (SNR) and Feature Rank
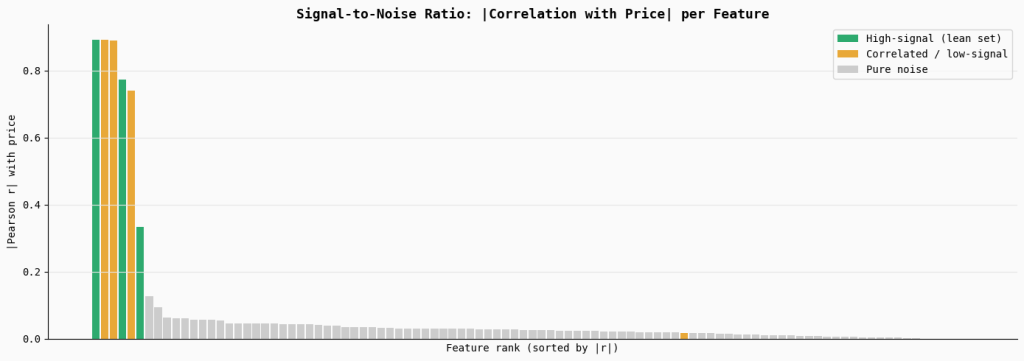
A critical component of model reliability is the Signal-to-Noise Ratio (SNR). In a healthy regression model, the features with the highest correlation to the target variable should carry the most weight. However, as the number of irrelevant or "pure noise" features increases, the overall SNR of the dataset degrades.
In the benchmark analysis, features were ranked by their absolute correlation with property prices. While core features like square footage showed high Pearson r values, a large set of 90 random noise features showed correlations near zero. Despite their lack of predictive power, the inclusion of these features forces the model to search for patterns where none exist. Over time, the model may "hallucinate" relationships between noise and the target variable, a classic symptom of overfitting that is often masked by seemingly acceptable R-squared values on the training set.
Quantifying Sensitivity to Feature Drift
The final and perhaps most dangerous aspect of production fragility is sensitivity to feature drift. Feature drift occurs when the statistical distribution of an input variable changes over time, often due to external factors or changes in how data is collected.
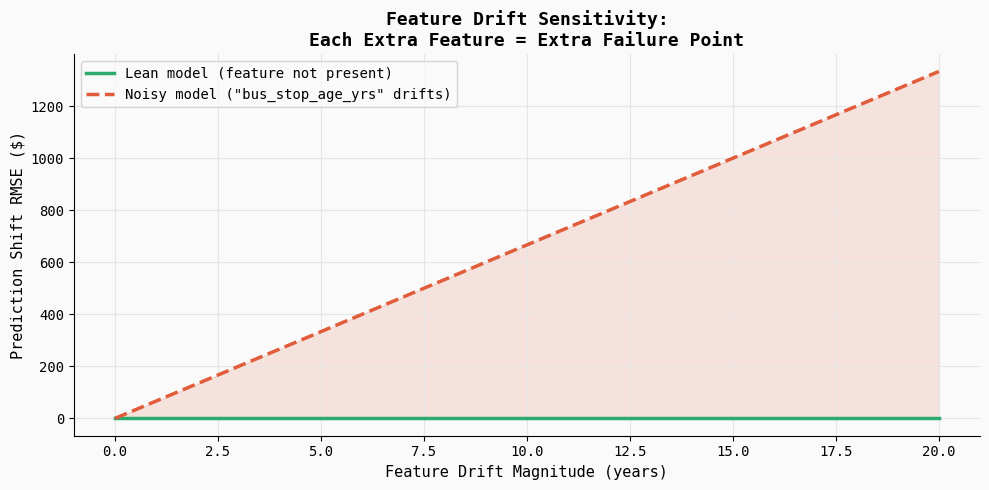
In a controlled experiment, drift was injected into a low-signal feature—specifically, the "age of the nearest bus stop"—which had a negligible real-world effect on property prices. The lean model, which excluded this feature, remained completely unaffected. However, the noisy model, which had assigned a non-zero weight to this variable during training, saw its prediction error (RMSE) increase steadily as the drift magnitude grew.
This experiment illustrates a vital production reality: every extra feature is an extra failure point. Even a variable that contributes almost nothing to the model’s accuracy can become a primary driver of error if its data quality fails. In complex systems, these "silent failures" are difficult to debug because the model continues to provide outputs, but those outputs are increasingly untethered from reality.
Industry Perspectives and MLOps Implications
Data science leads and MLOps (Machine Learning Operations) practitioners are increasingly advocating for "feature parsimony." The consensus among industry experts is that the complexity of a model should be commensurate with the signal available in the data.
"The goal of a production model is not just to minimize error on a holdout set, but to maximize reliability over its entire lifecycle," says one senior ML engineer. "Every time you add a feature, you are taking on technical debt. You are betting that the signal that feature provides today will remain stable and available for the next two years. More often than not, that’s a losing bet."
From a regulatory and compliance standpoint, especially in sectors like finance and healthcare, the weight instability caused by feature bloat poses a significant risk. If a model’s coefficients shift drastically after a routine retraining, it becomes nearly impossible to explain to auditors or stakeholders why a specific prediction was made. Lean models, by contrast, offer a level of transparency and "explainability" that is essential for high-stakes decision-making.
Broader Impact and Strategic Recommendations
The move away from "kitchen-sink" modeling reflects a maturing of the data science field. As organizations move from experimental prototypes to mission-critical AI deployments, the focus is shifting from raw accuracy to robust performance.
To mitigate the risks of production fragility, organizations are encouraged to adopt several strategic practices:
- Rigorous Feature Selection: Utilizing techniques like Recursive Feature Elimination (RFE) or LASSO (L1) regularization to actively prune low-signal variables.
- Stability Testing: Incorporating "retraining simulations" into the model validation pipeline to measure how much coefficients shift when the training data is perturbed.
- Drift Monitoring: Implementing real-time monitoring not just for the model’s output, but for the distribution of every input feature, with a specific focus on identifying when a low-signal feature begins to behave erratically.
- Prioritizing Interpretability: Favouring models where the relationship between inputs and outputs is clear and aligns with domain expertise.
In conclusion, while the temptation to include more features is high, the evidence suggests that "less is more" in the world of production regression. A lean model built on high-signal, independent variables is far more likely to withstand the rigors of the real world than a bloated model that relies on a fragile web of redundant data. By quantifying the risks of weight instability and drift sensitivity, data scientists can build systems that are not only accurate but also resilient, predictable, and maintainable over the long term.